Windows Logging for SOC
Start your Windows monitoring journey by learning how to use system logs to detect threats.
Task 1 Introduction
Task 1 introduces the Windows Logging room by emphasizing that SOC analysts spend most of their time triaging SIEM alerts and proactively hunting threats tasks that rely entirely on the ability to read, interpret, and contextualize Windows event logs. It stresses that distinguishing normal activity from malicious behavior requires deep familiarity with log formats, key fields, and attacker-indicating patterns. The task outlines the main learning objectives: mastering core Windows Event Logs (how to locate and understand them), exploring critical enhanced sources like Sysmon (for process/network/file visibility) and PowerShell logging (for script execution tracking), preparing for their use in SOC simulation environments and future rooms, and practicing hands-on analysis across multiple realistic event log datasets. This sets the foundation for building practical, high-impact Windows log investigation skills essential for any SOC or DFIR role.
Task 2 What Is Logged
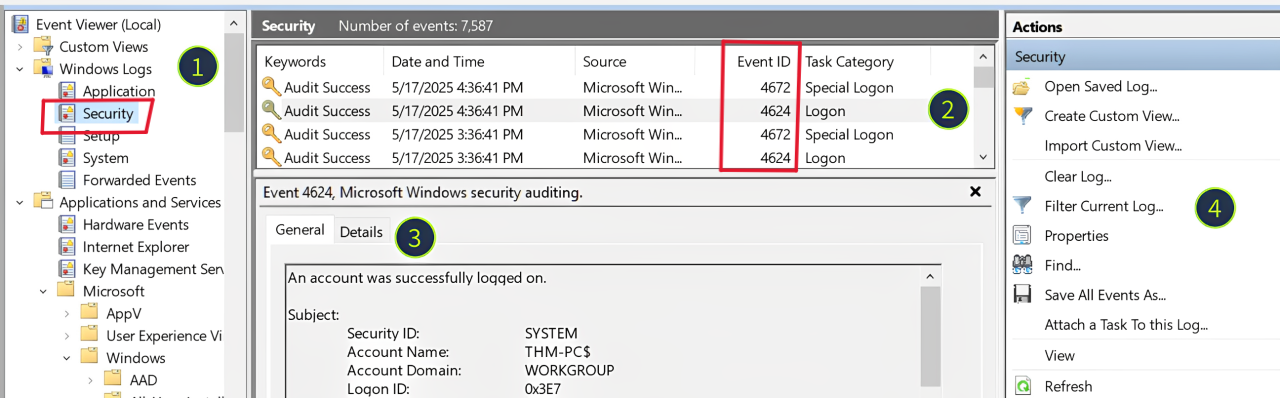
Task 2, “What Is Logged,” provides an essential overview of Windows event logging fundamentals. It explains that the OS records user and system actions (program execution, file changes, logons, etc.) as timestamped log entries, which are critical for incident response (attack reconstruction), threat hunting (IOC discovery), and alert triage/detection engineering. Logs are stored in binary .evtx format under C:\Windows\System32\winevt\Logs, with each file representing a channel (e.g., Security for logons and process activity, System for OS events, Application for app-specific logs). The task introduces Event Viewer (eventvwr.msc) as the primary tool for viewing logs, detailing its layout: the left panel for log sources, middle table for sortable events (by Event ID, time, level, keywords), bottom details pane (General/XML views), and filtering/export options. It notes the sheer volume of Event IDs (500+ in Security alone) and that many valuable events require explicit enabling, preparing you to focus on the most SOC-relevant logs in subsequent tasks.
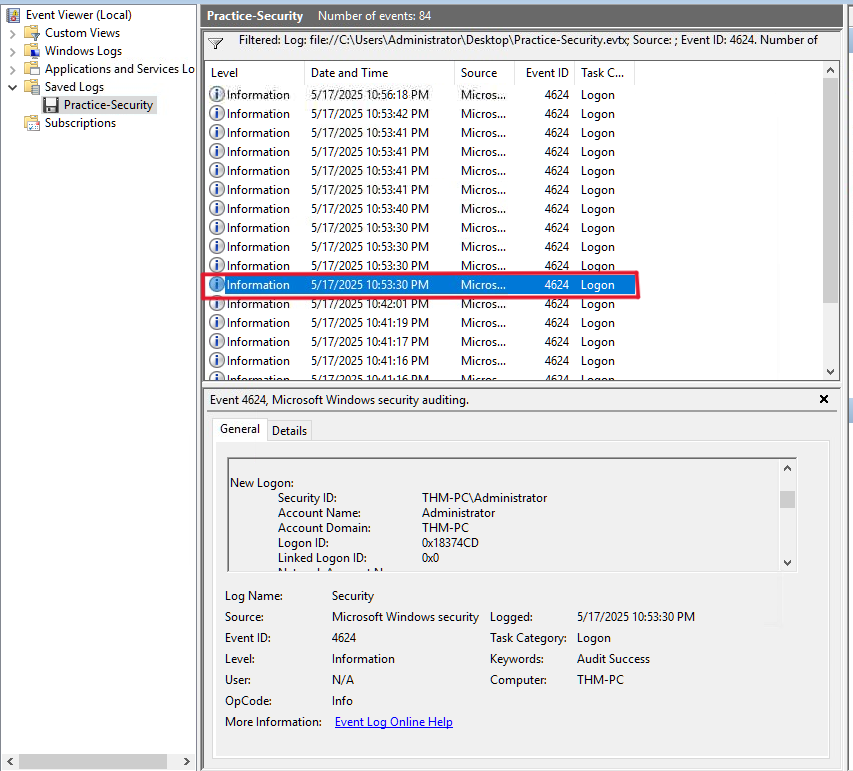
Q1: Looking at the last screenshot, which event ID describes a successful login?(Answer format: LogSource / ID, e.g. Application / 8194)
Answer: Security / 4624
Task 3 Security Log: Authentication
Task 3, “Security Log: Authentication,” highlights the Windows Security event log as the single most valuable default-enabled log source for SOC analysts due to its rich capture of identity and privilege events. The task focuses on the two cornerstone authentication events: Event ID 4624 (Successful Logon used to detect suspicious RDP/network access and trace attack entry points) and Event ID 4625 (Failed Logon key for identifying brute force, password spraying, or scanning). Both are logged only on the target machine receiving the authentication attempt. It outlines major limitations 4624 is extremely noisy (hundreds of events per minute on servers), while 4625 has many field inconsistencies that can mislead triage and emphasizes checking core fields like Logon Type (2=interactive, 3=network, 10=RDP), Source Network Address/IP, Account Name/Domain, Workstation Name, and Authentication Package. The task notes that even seasoned admins often need guidance to separate benign from malicious events and encourages treating this knowledge as foundational for ongoing SOC, hunting, and IR work, with deeper field documentation available in the Event ID Encyclopedia.
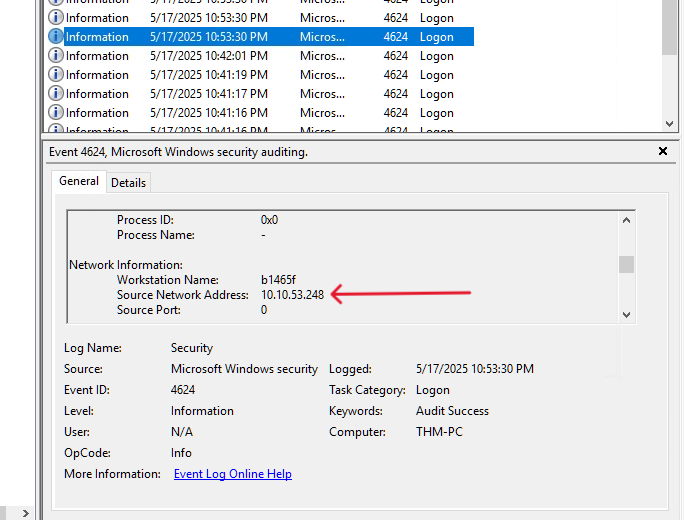
Q1: Open the “Practice-Security.evtx” file on the VM’s Desktop. Which IP performed a brute force of the THM-PC?
Answer: 10.10.53.248
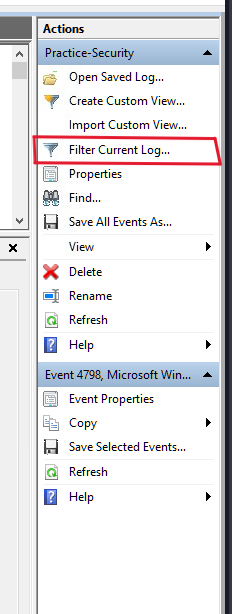
As we know A brute force attack is a cyberattack method where an attacker systematically attempts every possible combination of passwords, usernames, or encryption keys until the correct one is found. So there will be failed login attempts. So to detect brute force, we will filter for 4625 event ID (Failed login attempts).
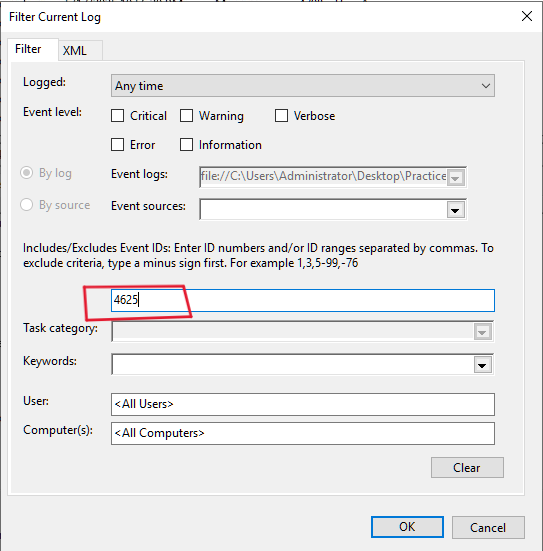
Then hit OK!
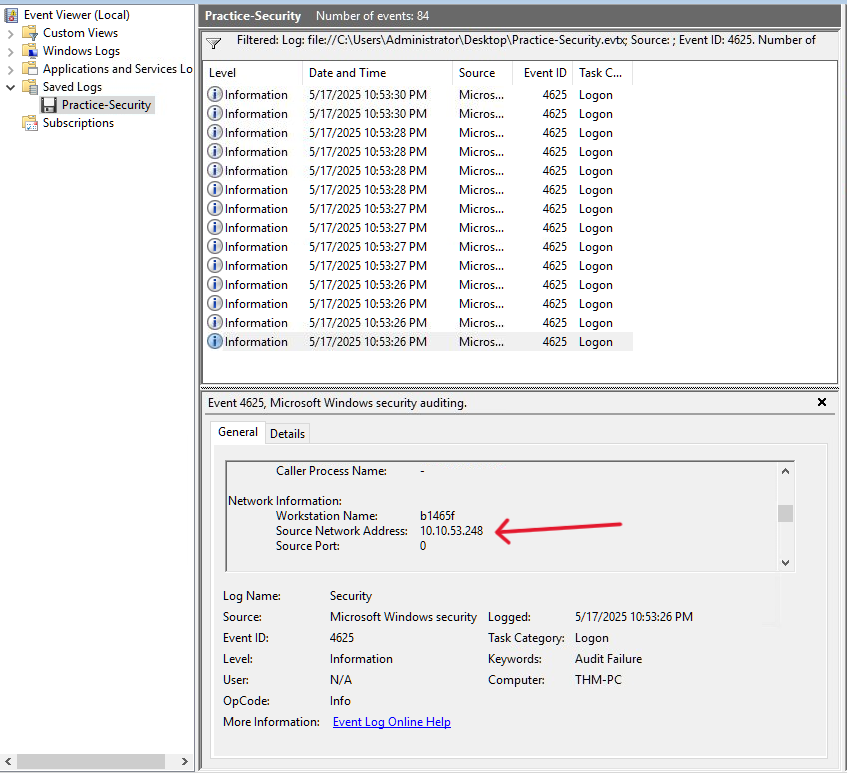
As we can see from the screenshot, there are 14 failed login attempts from the same IP address which is 10.10.53.248
Q2: Which user has been breached as a result of the attack?
Answer: Administrator
If the brute force succussed, there will be a success login from that malicious IP. So we will filter for 4624 event ID (Successful logins). the last fail attempt was at 10:53:30 PM. So we will start from that time.
As we can see, At 10:53:30, there was a successful login into the Administrator’s account. and it was from the same malicious IP!. so we are now sure that the Administrator’s account has been breached.
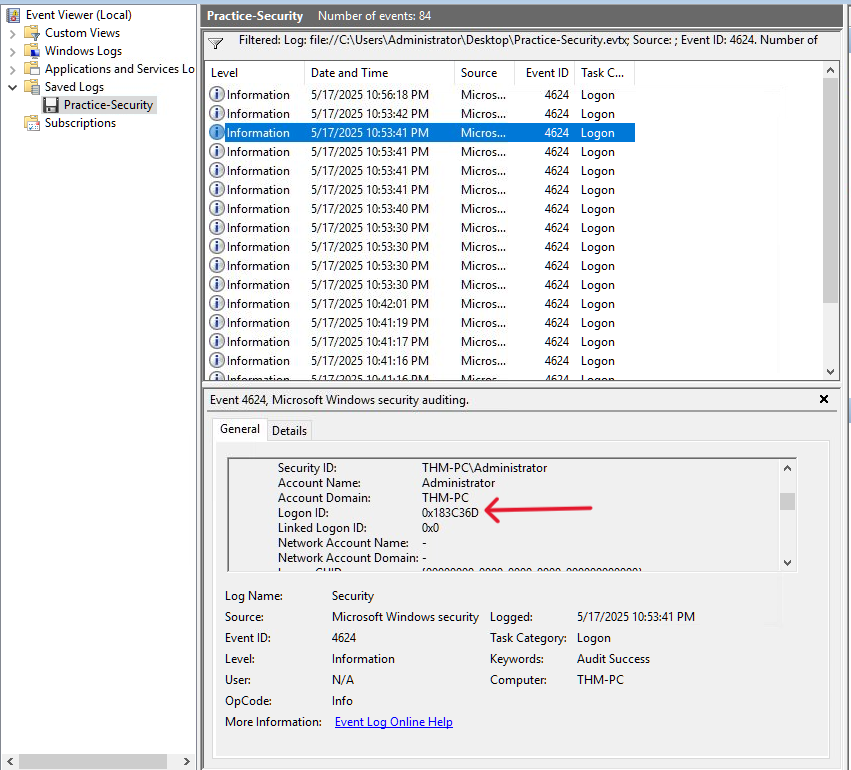
Q3: What was the Logon ID of the malicious RDP login? Note: The login you are looking for has a Logon Type 10.
Answer: 0x183C36D
As mentioned, we are looking for logon type 10. there are two ways to get the answer:
- First way: is to manually exploring every log until you reach a log with logon type 10.
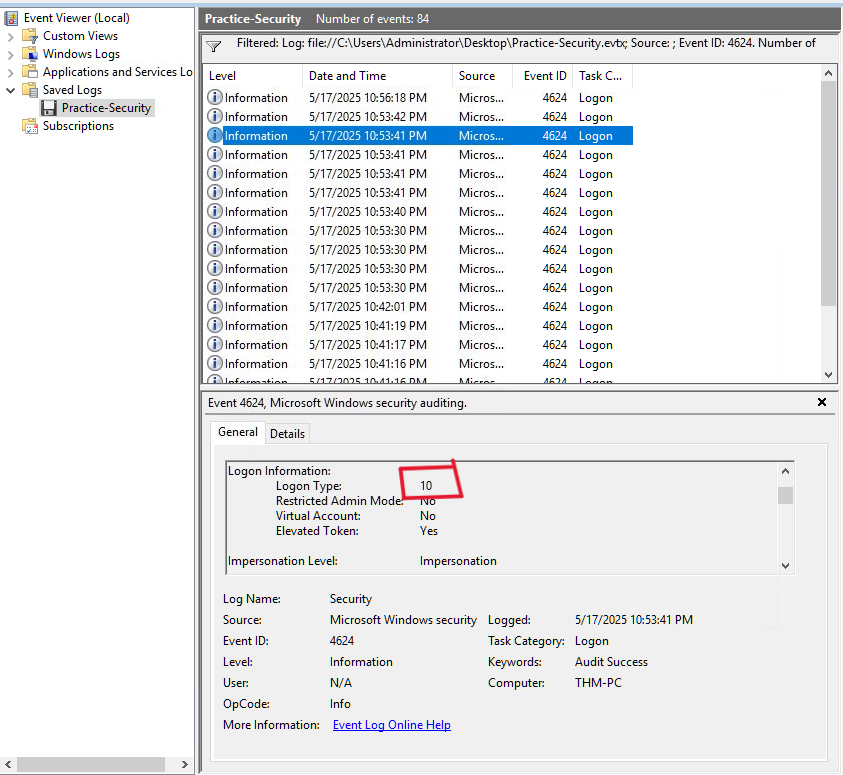
Scroll down and we will find the Logon ID
- Another fast way is to use XML query in the filter tab:
I added and EventData[Data[@Name='LogonType']='10'] to the query. This will give us only logs with logon type 10.
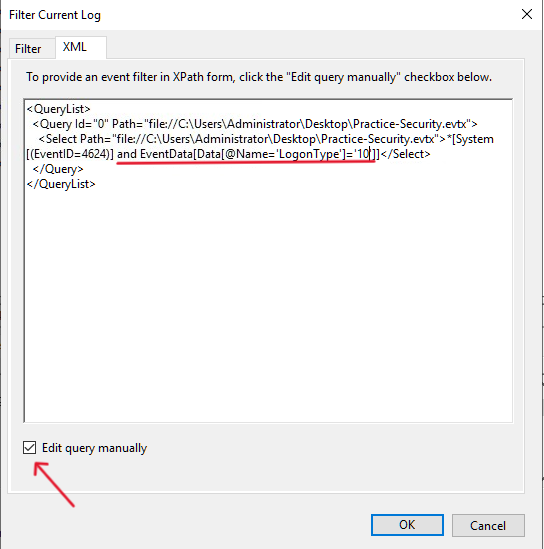
Then hit OK!
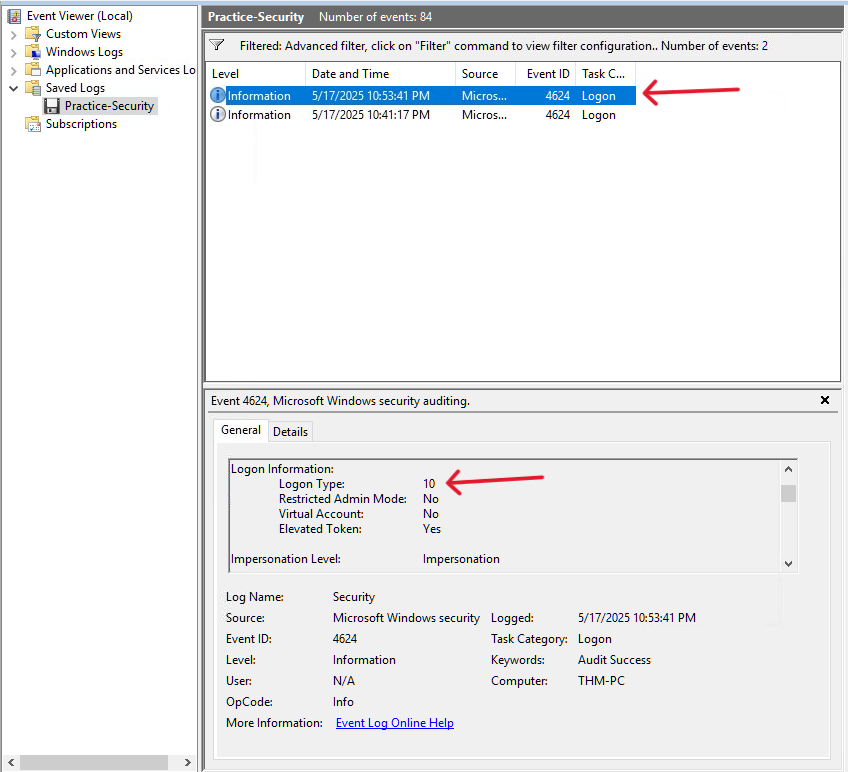
As we can see, we have just 2 logs with logon type 10. First one is what we want.
Task 4 Security Log: User Management
Task 4, “Security Log: User Management,” focuses on detecting account and group manipulation a frequent tactic in ransomware, persistence, and privilege escalation attacks. It opens with a realistic scenario where an unrecognized service account (“svc_sysrestore”) is dismissed as benign, illustrating how attackers exploit this blind spot. The task breaks down the key Security log Event IDs: 4720/4722/4738 (account created/enabled/changed), 4725/4726 (disabled/deleted), 4723/4724 (password changed/reset), and 4732/4733 (added to/removed from security groups like Administrators). It explains their malicious usage (backdoor creation, enabling dormant accounts, disabling defender accounts, bulk password resets) and describes the consistent three-part structure of these events: Subject (who did it, including Logon ID for 4624 correlation), Object/Target (the affected account or member), and Details (specific changes, e.g., group name or new attributes). The task emphasizes hunting these events to uncover attacker persistence or escalation, with real breach examples and workbook references for practical analysis. Mastering these IDs is critical for identifying identity-based attacks early in the incident lifecycle.
Q1: Continue with the “Practice-Security.evtx” file on the VM’s Desktop. Which user was created by the attacker soon after the RDP login?
Answer: svc_sysrestore
We will filter for 4720 event ID to find new users created.
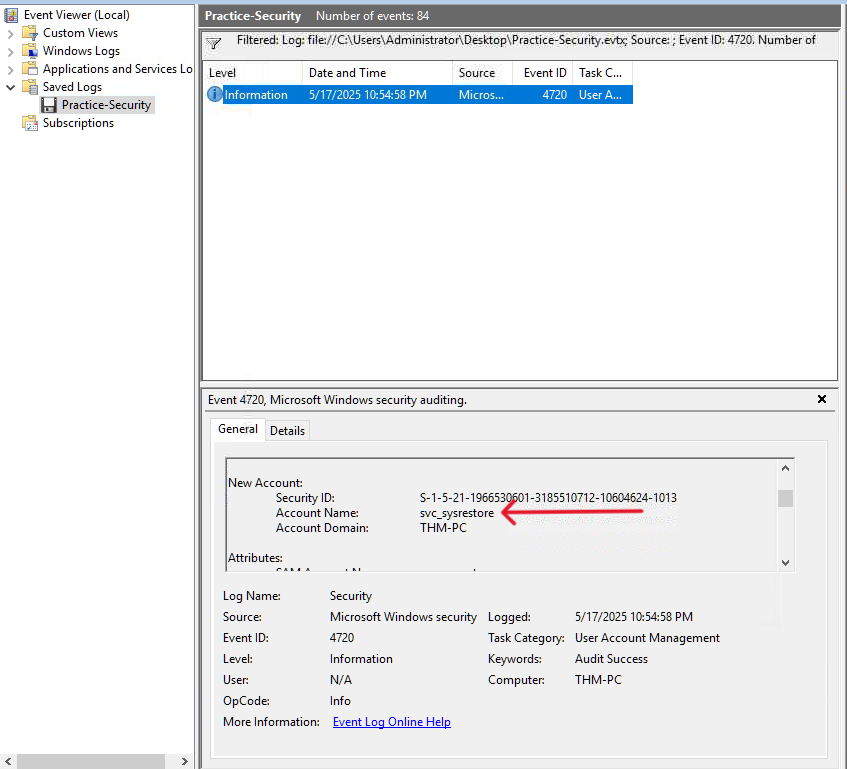
As we can see, we have only 1 event and a new user was created with account name svc_sysrestore.
Q2: Which two privileged groups was the backdoor user added to?(Answer in alphabetical order, e.g. “Administrators, Power Users”)
Answer: Backup Operators, Remote Desktop Users
To view the privileged groups the backdoor user was added, we will filter for 4732 event ID.
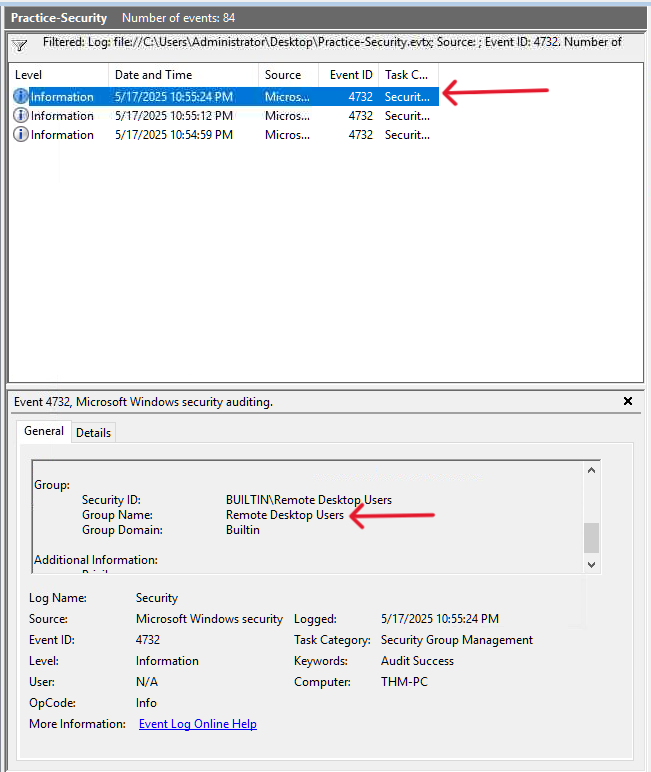
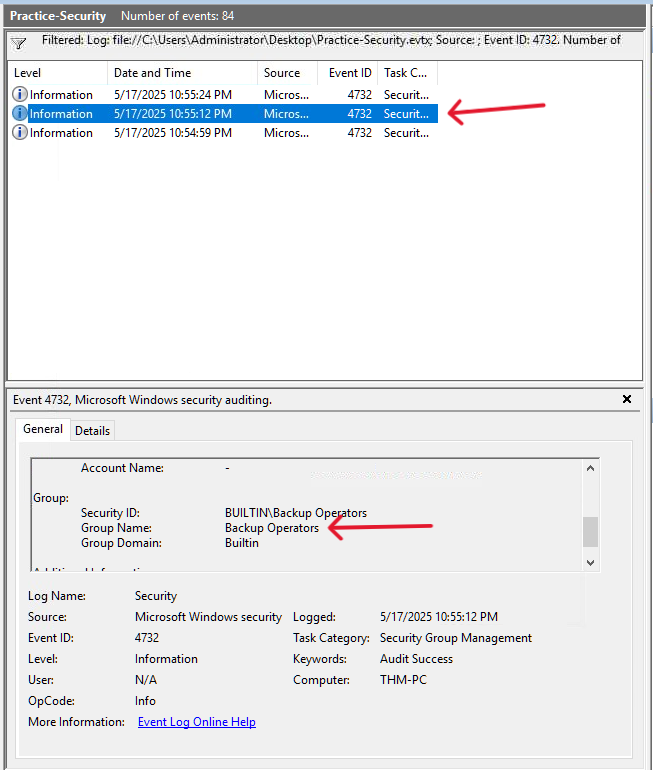
As we can see, the privileged groups the backdoor user was added are Backup Operators and Remote Desktop Users
Q3: Does the Logon ID field match what you saw in the previous task (Yea/Nay)?
Answer: Yea
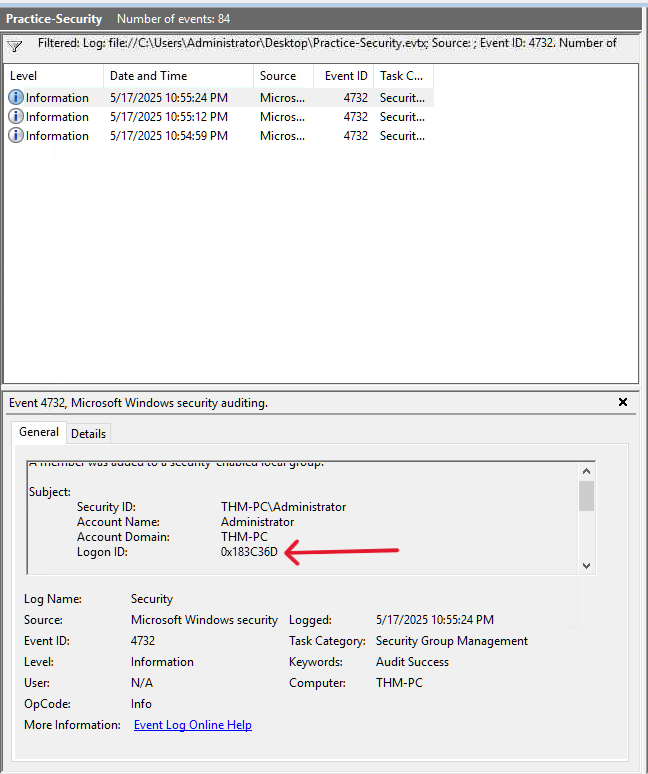
As we can see, the login ID is the same.
Task 5 Sysmon: Process Monitoring
Task 5, “Sysmon: Process Monitoring,” addresses a major limitation of default Windows logging: the inability to see how a breach occurred even after identifying compromised accounts. It contrasts two options for process creation visibility the native Security log Event ID 4688 (disabled by default, noisy, basic fields) versus Sysmon Event ID 1 (advanced, free Sysinternals tool requiring installation). The task strongly recommends Sysmon for its richer data (command lines, parent-child relationships, hashes, signatures, PE metadata) and places its logs in Event Viewer under Applications and Services Logs → Microsoft → Windows → Sysmon → Operational. It groups Sysmon Event ID 1’s critical fields into four categories: Process Info (Image, CommandLine, PID), Parent Info (ParentImage, PPID key for attack chain reconstruction), Binary Info (hashes, signature status), and User Context (User, LogonId for correlation with 4624 events). The task concludes that process monitoring via Sysmon is arguably the most valuable endpoint log source for SOC teams, enabling detection of execution, living-off-the-land binaries, and post-exploitation activity, with a workbook provided for hands-on analysis practice.
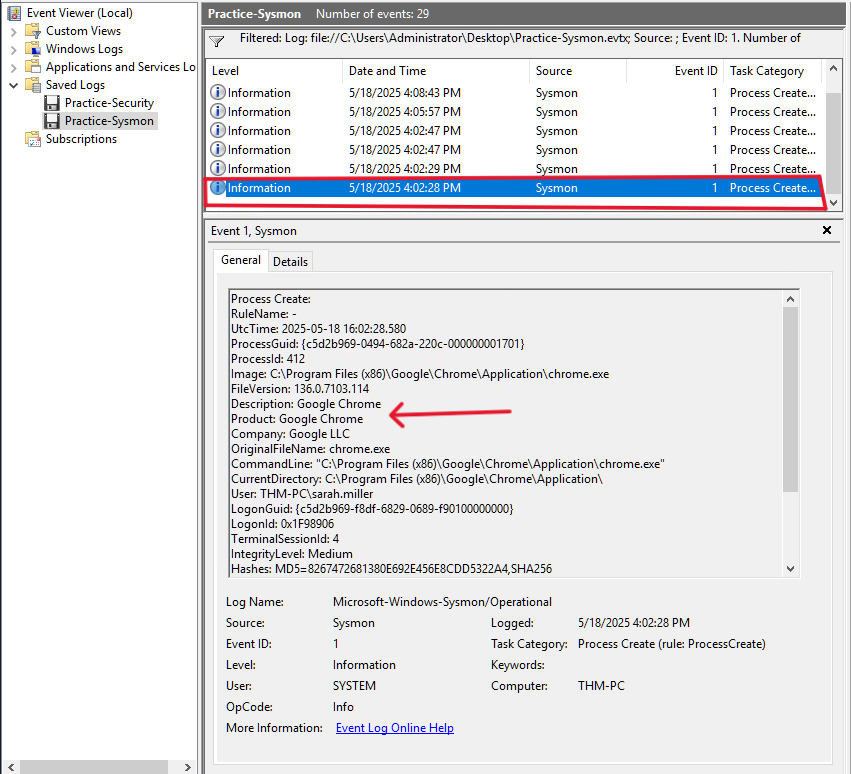
Q1: Open the “Practice-Sysmon.evtx” file on the VM’s Desktop. Which web browser does Sarah use to browse the web?
Answer: Google Chrome
If Sarah used a web browser, so there will be a process creation log for that browser. So we will filter for 1 event ID (Process Creation). if we scroll down to the first process creation at bottom, we can see that Sarah used Google Chrome.
Q2: Which file did Sarah download from the browser?
Answer: C:\Users\sarah.miller\Downloads\ckjg.exe
If we continue exploring, we will find that at 4:08:43, a new process created.
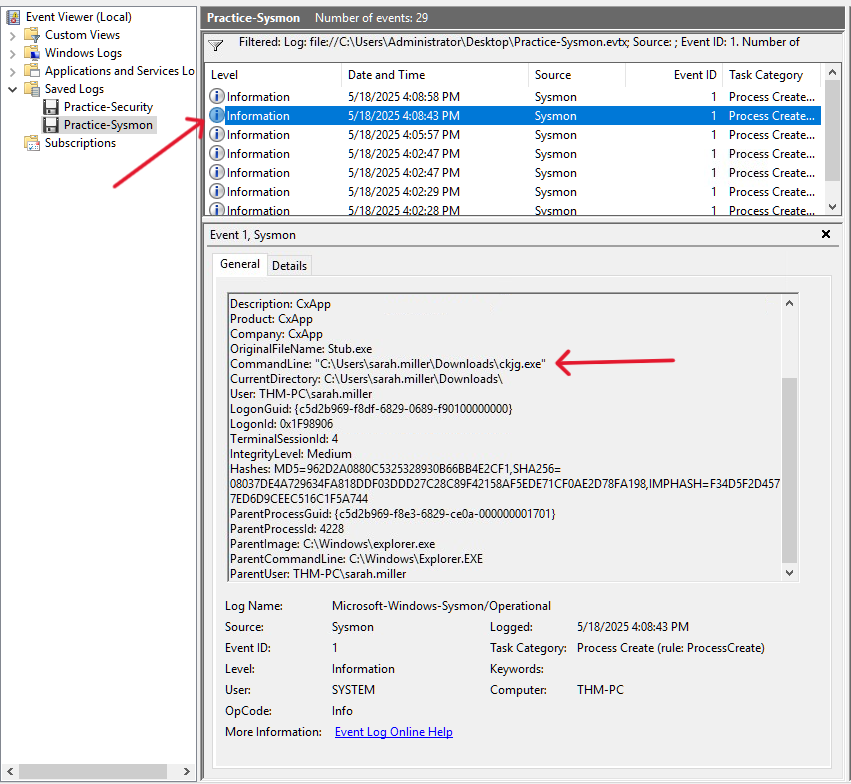
As we can see that the command used to download the malicious file is “C:\Users\sarah.miller\Downloads\ckjg.exe”
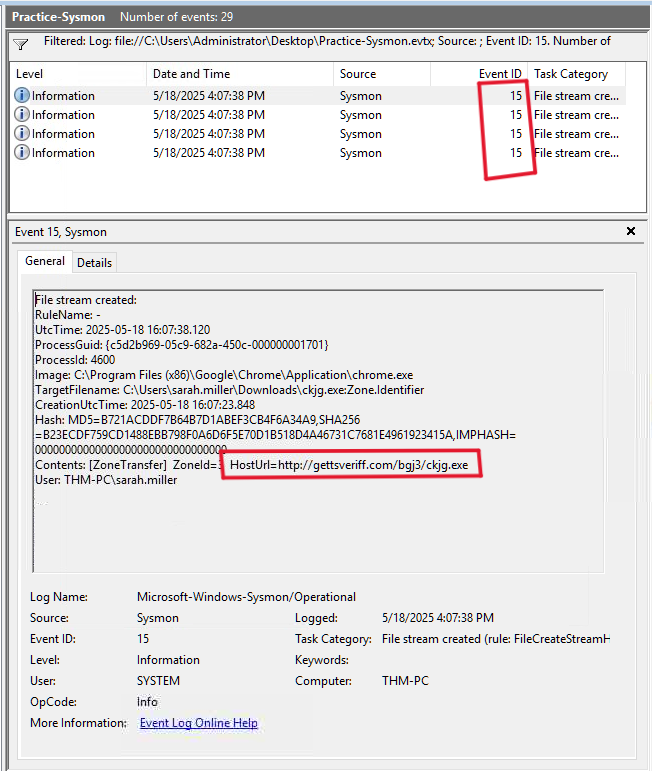
Q3: Which URL was the file downloaded from? Note: Use other Sysmon events to find out!
Answer: http://gettsveriff.com/bgj3/ckjg.exe
For this question, i explored the website mentioned in the hint. I found that we can filter for 15 event ID to find the Url.
Task 6 Sysmon: Files and Network
Task 6, “Sysmon: Files and Network,” expands Sysmon’s capabilities beyond process creation (Event ID 1) to cover file creation (Event 11), registry value sets (Event 13), network connections (Event 3), and DNS queries (Event 22). It notes that Sysmon is highly configurable (using community configs like Florian’s) and fills visibility gaps where native Security log alternatives (e.g., 4656/4657) are disabled by default or require complex setup. The task highlights consistent field patterns across Sysmon events (Image, ProcessId, UtcTime, User) and explains that missing context (Logon ID, parent info) is resolved by correlating to the matching Event ID 1 via ProcessId. These events are vital for detecting dropped malware files, persistence via registry, suspicious network traffic, C2/exfiltration destinations, and malicious DNS resolutions , enabling full attack chain reconstruction. The task reinforces Sysmon’s role as a cornerstone of endpoint monitoring, complementing process logs to ensure comprehensive visibility into adversary behavior.
Q1: Continue with the “Practice-Sysmon.evtx” file on the VM’s Desktop. Which file was created by the downloaded malware to persist on the host?
Answer: C:\Users\sarah.miller\AppData\Roaming\Microsoft\Windows\Start Menu\Programs\Startup\DeleteApp.url
We can filter for 11 event ID (File Create).
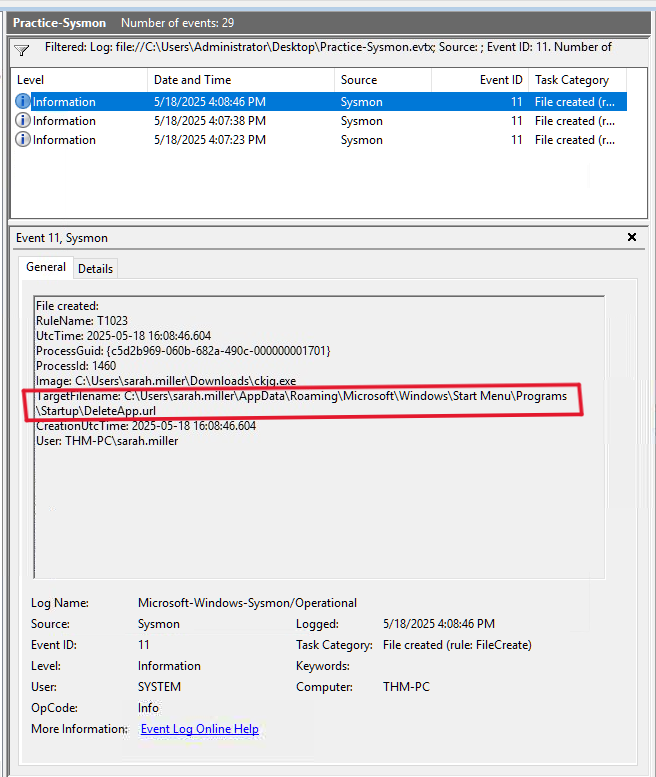
As we can see, the malicious file (ckjg.exe) created another file to persist on the infected machine.
Q2: What is the Command & Control server malware connected to? (Answer in format IP:Port, e.g. 1.1.1.1:80)
Answer: 193.46.217.4:7777
We can look at network connections to see what C2 server malware connected to by filtering for 3 event ID (Network Connection).
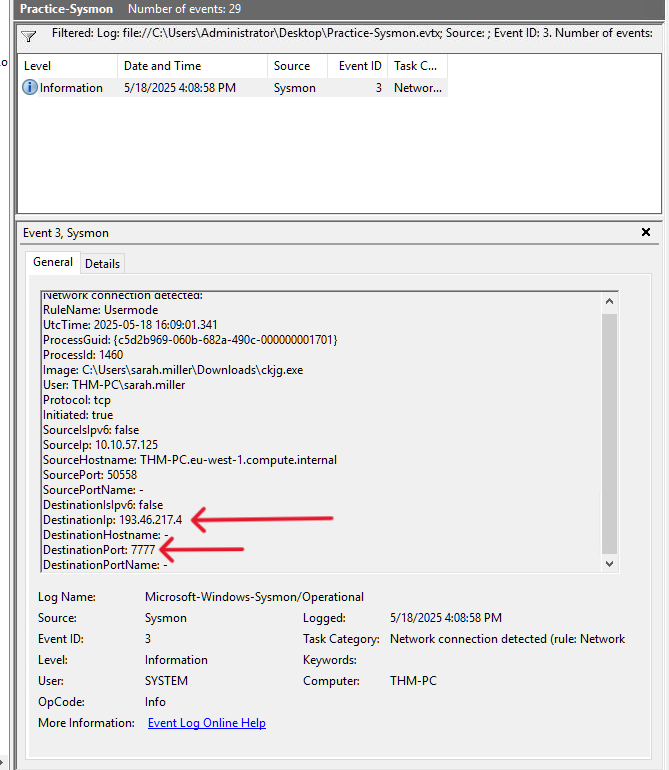
As we can see, DestinationIP (C2 server) is 193.46.217.4 and connected via port 7777.
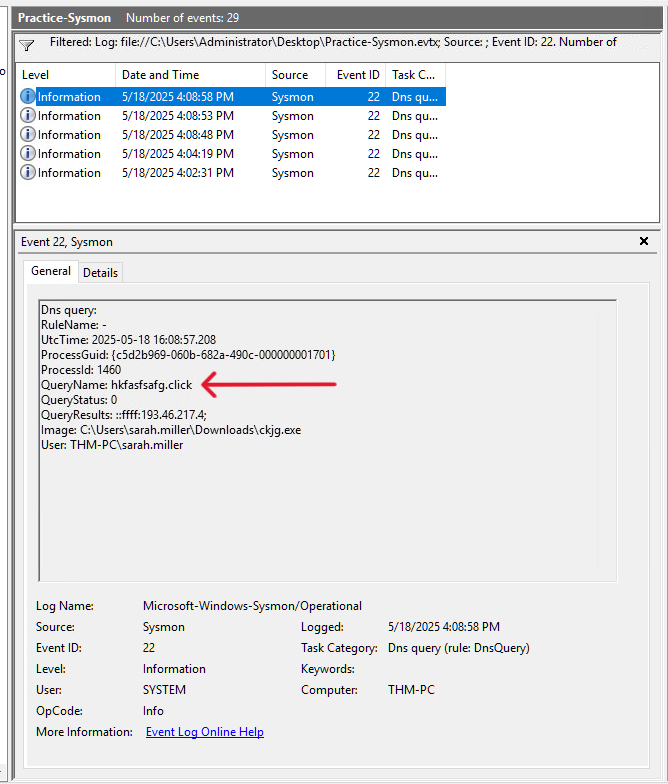
Q3: Finally, which domain does the malicious IP correspond to?
Answer: hkfasfsafg.click
We can filter for 22 event ID (DNS Query) to see the corresponding domain.
Task 7 PowerShell: Logging Commands
Task 7, “PowerShell: Logging Commands,” addresses a major detection blind spot: PowerShell’s ability to execute reconnaissance, file access, malware downloads, and advanced techniques (process injection, in-memory execution) within a single powershell.exe process rendering Sysmon Event ID 1 and similar process logs insufficient. The task demonstrates malicious examples (enumerating users/groups, reading secrets.txt, downloading from C2) that produce no additional process events. It explains that PowerShell is a multi-purpose shell/scripting engine, allowing hundreds of cmdlets without spawning new processes. The primary logging method covered is the PowerShell history file located at C:\Users<USER>\AppData\Roaming\Microsoft\Windows\PowerShell\PSReadline\ConsoleHost_history.txt. a plain-text, per-user file that records every interactively submitted command immediately upon Enter. Key notes include its persistence across reboots, usefulness for detecting common attack patterns, and limitations: no command output, no script content (e.g., .\script.ps1), and vulnerability to clearing or bypass.
Q1: Review the Administrator’s PS history on the attached VM. Which PowerShell command was executed first?
Answer: Get-ComputerInfo
As mention in the task explanation, we can view PS history at: C:\Users\<USER>\AppData\Roaming\Microsoft\Windows\PowerShell\PSReadline\ConsoleHost_history.txt
So for Administrator’s PS history → C:\Users\Administrator\AppData\Roaming\Microsoft\Windows\PowerShell\PSReadline\ConsoleHost_history.txt
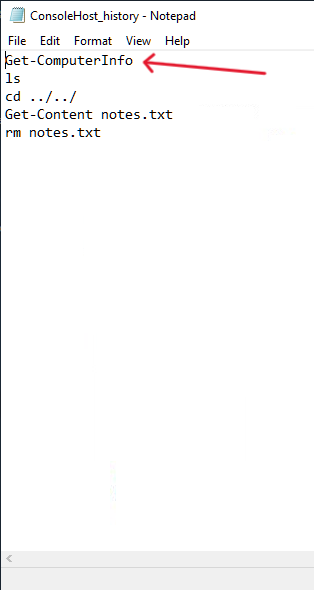
As we can see, The PowerShell command was executed first was Get-ComputerInfo
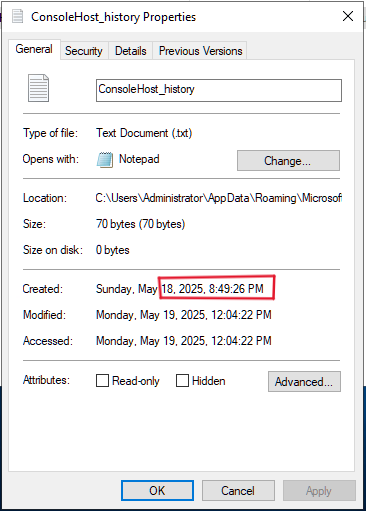
Q2: When did the Administrator run the first PS command? (Format: April 18, 2025) Note: You might need to right-click the history file and open “Properties” to get the answer!
Answer: May 18, 2025
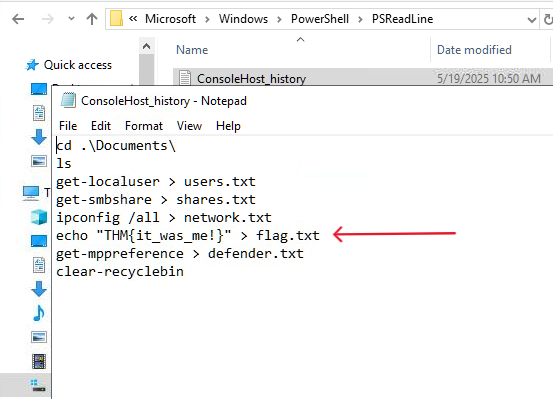
Q3: Can you find the flag stored in the PowerShell history? (Format: THM{…}) Note: You might want to check the PS history of other local users!
Answer: THM{it_was_me!}
Just explore every user’s PowerShell history and you will get the flag :)
I hope this writeup has given you a solid understanding of Windows logging and helped strengthen your SOC and incident response skills. thank you for reading!😊