Splunk The Basics
Understand how SOC analysts use Splunk for log investigations.
Task 3 Splunk Components
Splunk has three main components: Forwarder, Indexer, and Search Head. These components work together to collect, process, store, and analyze machine data effectively.
Splunk Forwarder The Splunk Forwarder is a lightweight agent installed on the systems we want to monitor. Its main job is to collect raw data from different sources and send it to the Splunk Indexer without affecting the performance of the endpoint. Common data sources include web server logs, Windows Event Logs, PowerShell, Sysmon, Linux host logs, and database logs.
Splunk Indexer The Splunk Indexer is the core component that receives data from the Forwarder. It parses the raw data, normalizes it into field-value pairs, categorizes events, and stores the processed data in a searchable format.
Splunk Search Head The Splunk Search Head is the user interface where we perform searches. Using the Search & Reporting App and Splunk Processing Language (SPL), we can search the indexed data. The Search Head sends queries to the Indexer and displays the results. It also allows us to create tables and visualizations such as pie charts, bar charts, and column charts.
These three components work in harmony: the Forwarder collects the data, the Indexer processes and stores it, and the Search Head provides the interface for users to search, analyze, and visualize the data effectively.
Q1: Which component is used to collect and send data over the Splunk instance?
Answer: Forwarder
As mentioned, Forwarder is used to collect and send data over the Splunk instance.
Task 4 Navigating Splunk
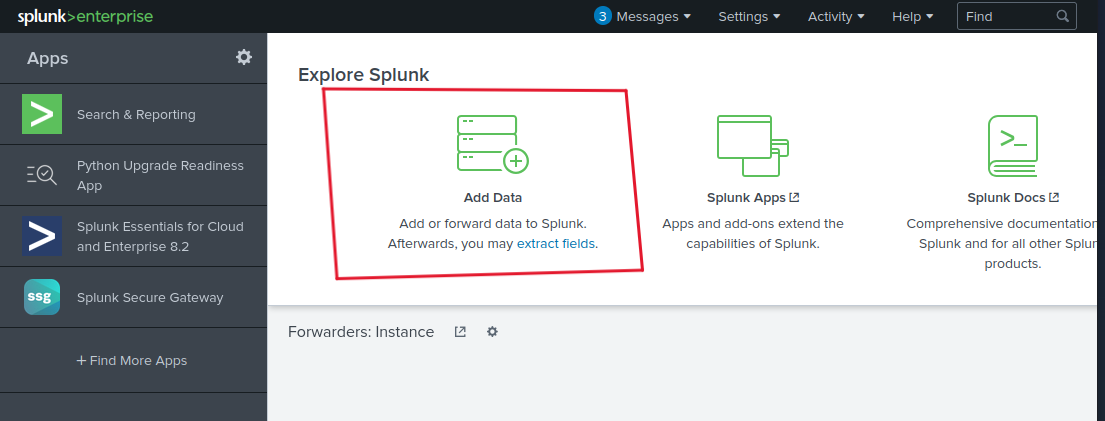
Task 4 explains the layout of the Splunk home screen and how to navigate its different sections. When you log into Splunk, the default home screen consists of the Splunk Bar at the top, which provides quick access to Messages, Settings, Activity, Help, and Find options, and also allows switching between installed apps. Below it is the Apps Panel that displays installed applications, with the Search & Reporting app being the default one. The Explore Splunk section offers quick links to add data, install new apps, and access documentation. Finally, the Home Dashboard area allows users to view and select pre-built dashboards or create their own, with custom dashboards accessible under the Yours tab. Overall, these sections work together to provide an intuitive interface for navigating and working within Splunk.
Q1: In the Add Data tab, which option is used to collect data from files and ports?
Answer: Monitor
In the explore splunk section, choose Add Data.
you will see 3 methods at the bottom.
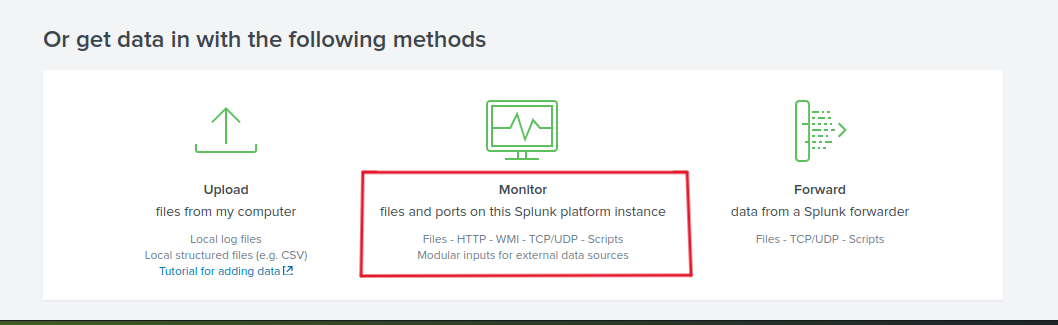
As we can see, the Monitor option is used to collect data from files and ports.
Task 5 Adding Data
Task 5 explains how Splunk can ingest almost any type of machine data. When data is added to Splunk, it is processed and transformed into a series of individual events that can be easily searched and analyzed. Data sources can include event logs, website logs, firewall logs, and many others. These data sources are grouped into different categories, and the task provides a chart from the Splunk documentation that lists and explains each data source category to help users understand what kind of data can be ingested into Splunk.
Q1: Upload the data attached to this task **and create an index “VPN_Logs”. How many events are present in the log file?
Answer: 2862
Follow the steps mentioned in the task. After that, you will see the Search.
Set the time to All time to see the total number of events.
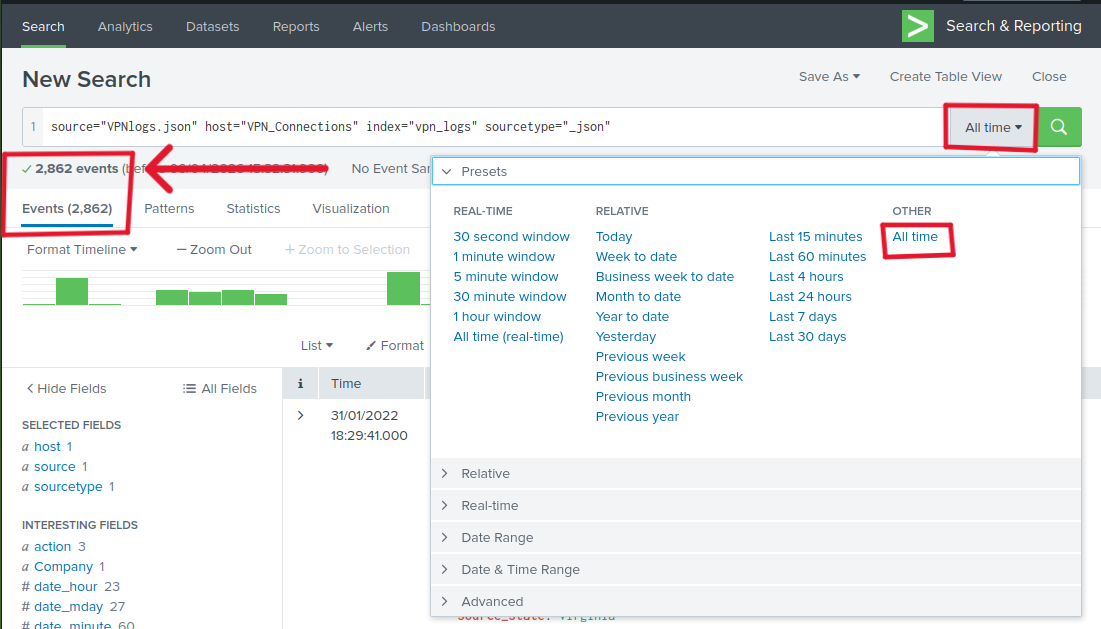
As we can see, there are 2862 events.
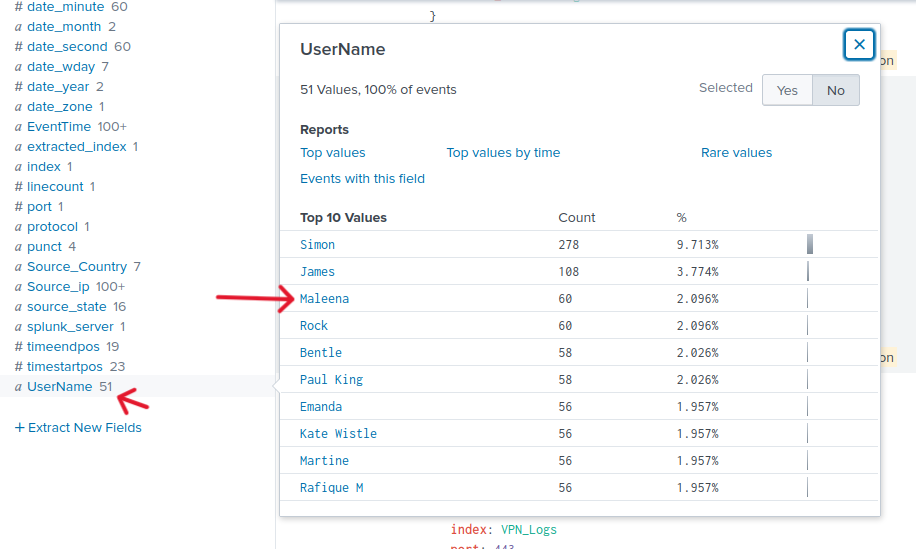
Q2: How many log events are captured by the user Maleena?
Answer: 60
You can find number of event using 2 ways:
- Using the Search Query that Splunk provide (SPL Search Processing Language). Add
UserName="Maleena”to the query.
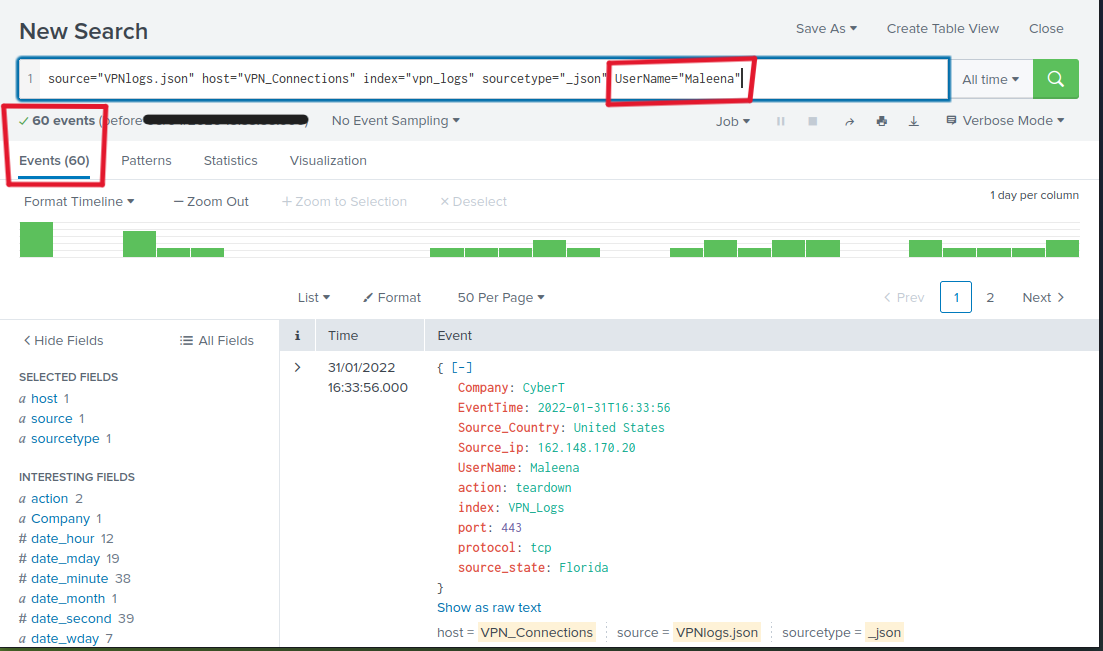
As we see there are 60 events captured by the user Maleena.
- Using the Fields on the left. Explore them and you will find UserName field, click on it and you will see users and their event count.
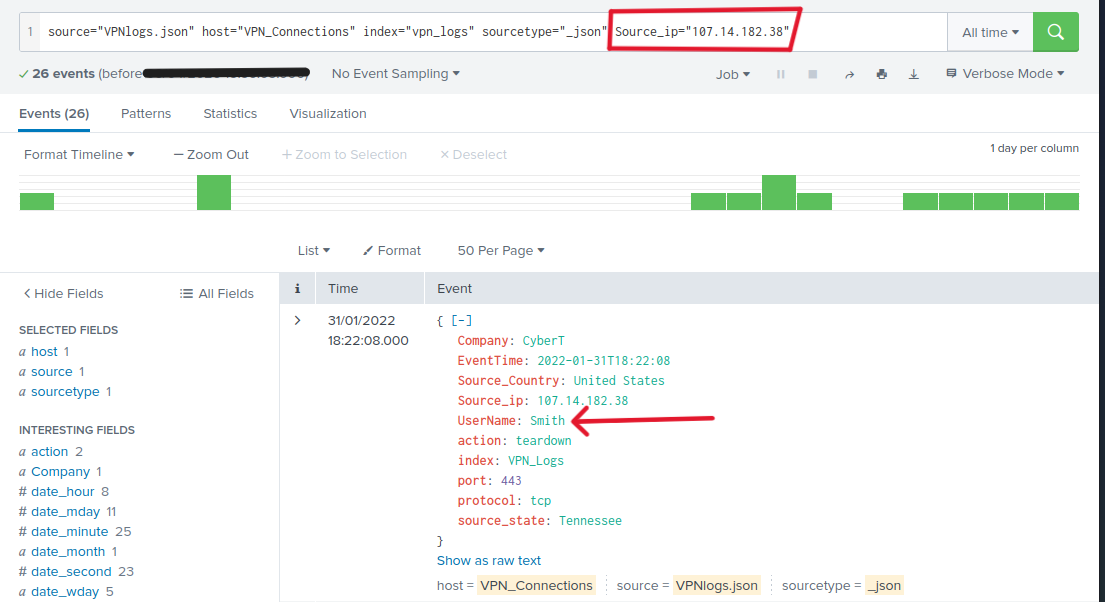
Q3: What is the username associated with IP 107.14.182.38?
Answer: Smith
Using the same idea from the previous task. Add Source_ip="107.14.182.38" to the query.
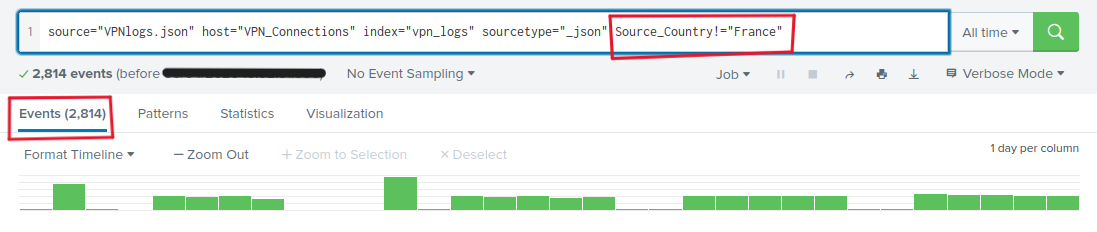
Q4: What is the number of events that originated from all countries except France?
Answer: 2814
we can exclude France from the search by adding Source_Country!="France” this way, you query all the countries except France.
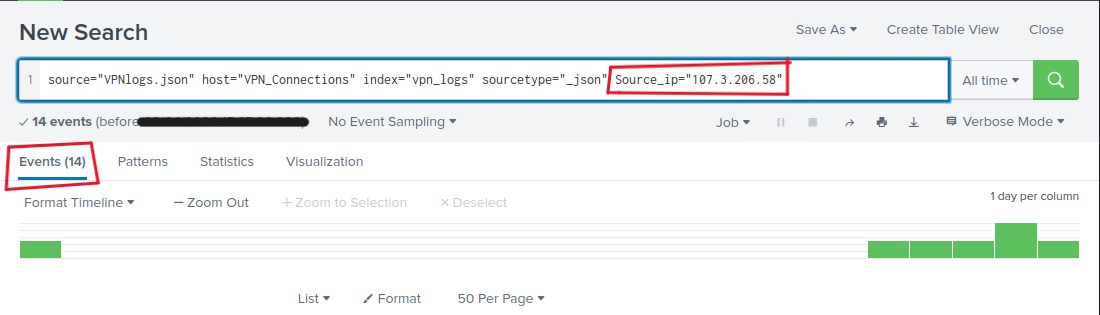
Q5: How many VPN events were associated with the IP 107.3.206.58?
Answer: 14
The same way as Q3. Adding Source_ip="107.3.206.58”
Thank you for reading my Splunk writeup. I hope this document helped you understand the basic concepts of Splunk, including its main components, navigation, and how to add data. I sincerely hope you found it useful and that it benefits you in your learning journey.😊